Monitoring TrueNAS With Prometheus and Loki
Technical howto article

Summary
I use Prometheus for monitoring in my self-hosting infrastructure,
but my TrueNAS box exposes metrics in the
Graphite protocol.
In this post, I describe how I use graphite_exporter
to collect metrics from TrueNAS with Prometheus,
and Rsyslog and Promtail to send logs to Loki.
Table of Contents
Documentation
- Graphite Exporter README file.
- Reporting settings in TrueNAS CORE documentation, for configuring Graphite metrics.
- Advanced system settings in TrueNAS CORE documentation, for configuring syslog.
Choosing the monitoring strategy
TrueNAS doesn’t expose metrics in the Prometheus format. I explored a few methods for collecting metrics with Prometheus.
- ❌ Installing packages on the base OS
- TrueNAS turns generic hardware into a network storage and hosting appliance.
Knowing that it’s based on FreeBSD, it would be simple to install Prometheus exporters on the system,
but this is not recommended because installing local packages can interfere with the appliance code.
The package managers
pkgandportsaren’t even enabled by default. - ❌ Plugins
- TrueNAS has a plugin system, but I don’t feel it has enough maintainers to trust a 3rd party plugin and I don’t want to write one myself.
- ❌ Using the API and writing an exporter
- One could write a
truenas_exporterthat would query the API. I checked the API documentation, it didn’t look like an easy API to work with. - ✅ Using natively available legacy telemetry and logging application streams
- I figured it would be easier to use the telemetry and logging protocols available out-of-the-box in TrueNAS,
and to convert them to Prometheus and Loki formats using a service outside of TrueNAS.
- metrics: using
graphite_exporterto convert metrics in Prometheus format. Continue reading below. - logs: using rsyslog and the syslog receiver in Promtail. Read Using Rsyslog and Promtail to relay syslog messages to Loki.
- metrics: using
Collecting logs from TrueNAS into Loki
I use rsyslog and Promtail to collect logs from TrueNAS and send them to Loki. See Using Rsyslog and Promtail to relay syslog messages to Loki for more details about setting up this logging pipeline.
In the TrueNAS configuration interface, under System > Advanced, you can set the hostname for your syslog server.
Collecting metrics from TrueNAS into Prometheus
Find the documentation in the README file in the GitHub repository:
https://github.com/prometheus/graphite_exporter
Deploy Graphite Exporter
I deployed graphite_exporter on my monitoring VM, along with Prometheus and Grafana.
It runs as a single process systemd service.
graphite_exporter has two listening ports:
- Carbon protocol listener on UDP port 9109. Must be changed to the Graphite default port 2300 to work with TrueNAS.
- HTTP Metrics endpoint on port 9108. This is the endpoint that Prometheus will scrape.
Here’s my systemd unit file:
[Unit]
Description=graphite_exporter
Wants=network-online.target
After=network-online.target

[Service]
User=graphite_exporter
Group=graphite_exporter
Type=simple
ExecStart=/usr/local/bin/graphite_exporter \
    --graphite.mapping-config=/etc/graphite_mappings.yaml \
    --graphite.listen-address=:2003

[Install]
WantedBy=multi-user.target
Mapping config
graphite_exporter requires a Graphite→Prometheus mapping file.
Mappings are defined in YAML format.
Here is my mapping config for converting TrueNAS metrics from Graphite to Prometheus format.
In my network, FQDNs have 4 components.
Graphite uses dots as a separate in its metrics namespace,
so dots in hostnames are converted to underscores.
In my mapping config, I use the ([^_]*)_([^_]*)_([^_]*)_([^_]*) regex
and the ‘${1}.${2}.${3}.${4}’ replacement string
to convert underscores back to dots in the instance label.
You may need to adjust your regex and shift the back references in your replacement strings
according to your network name services settings.
---
# All FreeNAS metrics start with server.<server_name>
# https://www.truenas.com/community/threads/mapping-of-freenas-data-sent-to-graphite_exporter-part-of-prometheus.80948/
# https://blog.bradbeattie.com/freenas-to-prometheus/

# Validate configuration with:
# /path/to/graphite_exporter --check-config --graphite.mapping-config=/path/to/this_file.yml
# graphite_exporter --check-config --graphite.mapping-config=files/configs/present/graphite_mapping-2.yml

# To develop mappings locally:
# graphite_exporter --log.level=debug --graphite.mapping-config=
# nc localhost 9109 < graphite-sample.txt
# curl localhost:9108/metrics -s | grep ^freenas | less

# Mapping syntax is based on statsd_exporter.
# https://github.com/prometheus/statsd_exporter#regular-expression-matching

mappings:

  - match: 'servers\.([^_]*)_([^_]*)_([^_]*)_([^_]*)\.disktemp-(.*)\.temperature'
    match_type: regex
    name: "freenas_disk_temperature"
    labels:
      instance: '${1}.${2}.${3}.${4}'
      job: freenas-graphite
      disk: '${5}'

  - match: 'servers\.([^_]*)_([^_]*)_([^_]*)_([^_]*)\.cputemp-(.*)\.temperature'
    match_type: regex
    name: "freenas_cpu_temperature"
    labels:
      instance: '${1}.${2}.${3}.${4}'
      job: freenas-graphite
      cpu: '${5}'

  # When "Report CPU usage in percent" is NOT selected. (default)
  - match: 'servers\.([^_]*)_([^_]*)_([^_]*)_([^_]*)\.aggregation_cpu_(.*)\.percent-(.*)'
    match_type: regex
    name: "freenas_cpu_percent_${5}"
    labels:
      instance: '${1}.${2}.${3}.${4}'
      job: freenas-graphite
      mode: '${6}'

  # When "Report CPU usage in percent" is selected.
  - match: 'servers\.([^_]*)_([^_]*)_([^_]*)_([^_]*)\.aggregation_cpu_(.*)\.cpu-(.*)'
    match_type: regex
    name: "freenas_cpu_usage_${5}"
    labels:
      instance: '${1}.${2}.${3}.${4}'
      job: freenas-graphite
      mode: '${6}'

  # When "Report CPU usage in percent" is NOT selected. (default)
  - match: 'servers\.([^_]*)_([^_]*)_([^_]*)_([^_]*)\.cpu-(.*)\.cpu-(.*)'
    match_type: regex
    name: "freenas_cpu_usage"
    labels:
      instance: '${1}.${2}.${3}.${4}'
      job: freenas-graphite
      cpu: '${5}'
      mode: '${6}'

  # When "Report CPU usage in percent" is selected.
  - match: 'servers\.([^_]*)_([^_]*)_([^_]*)_([^_]*)\.cpu-(.*)\.percent-(.*)'
    match_type: regex
    name: "freenas_cpu_percent"
    labels:
      instance: '${1}.${2}.${3}.${4}'
      job: freenas-graphite
      cpu: '${5}'
      mode: '${6}'

  - match: 'servers\.([^_]*)_([^_]*)_([^_]*)_([^_]*)\.df-(.*)\.df_complex-(.*)'
    match_type: regex
    name: 'freenas_df_${6}'
    labels:
      instance: '${1}.${2}.${3}.${4}'
      job: freenas-graphite
      filesystem: '${5}'

  - match: 'servers\.([^_]*)_([^_]*)_([^_]*)_([^_]*)\.disk-(.*)\.disk_(.*)\.(.*)'
    match_type: regex
    name: 'freenas_disk_${6}_${7}'
    labels:
      instance: '${1}.${2}.${3}.${4}'
      job: freenas-graphite
      device: '${5}'

  - match: 'servers\.([^_]*)_([^_]*)_([^_]*)_([^_]*)\.interface-(.*)\.if_(.*)\.(.*)'
    match_type: regex
    name: 'freenas_interface_${7}_${6}'
    labels:
      instance: '${1}.${2}.${3}.${4}'
      job: freenas-graphite
      interface: '${5}'

  - match: 'servers\.([^_]*)_([^_]*)_([^_]*)_([^_]*)\.load\.load\.longterm'
    match_type: regex
    name: 'freenas_load_15'
    labels:
      instance: '${1}.${2}.${3}.${4}'
      job: freenas-graphite
  - match: 'servers\.([^_]*)_([^_]*)_([^_]*)_([^_]*)\.load\.load\.midterm'
    match_type: regex
    name: 'freenas_load_5'
    labels:
      instance: '${1}.${2}.${3}.${4}'
      job: freenas-graphite
  - match: 'servers\.([^_]*)_([^_]*)_([^_]*)_([^_]*)\.load\.load\.shortterm'
    match_type: regex
    name: 'freenas_load_1'
    labels:
      instance: '${1}.${2}.${3}.${4}'
      job: freenas-graphite

  - match: 'servers\.([^_]*)_([^_]*)_([^_]*)_([^_]*)\.memory\.memory-(.*)'
    match_type: regex
    name: 'freenas_memory_${5}'
    labels:
      instance: '${1}.${2}.${3}.${4}'
      job: freenas-graphite

  - match: 'servers\.([^_]*)_([^_]*)_([^_]*)_([^_]*)\.swap\.swap-(.*)'
    match_type: regex
    name: 'freenas_swap_${5}'
    labels:
      instance: '${1}.${2}.${3}.${4}'
      job: freenas-graphite

  - match: 'servers\.([^_]*)_([^_]*)_([^_]*)_([^_]*)\.uptime\.uptime'
    match_type: regex
    name: freenas_uptime
    labels:
      job: freenas-graphite
      instance: "${1}.${2}.${3}.${4}"

  - match: 'servers\.([^_]*)_([^_]*)_([^_]*)_([^_]*)\.processes\.ps_state-(.*)'
    match_type: regex
    name: freenas_processes
    labels:
      job: freenas-graphite
      instance: "${1}.${2}.${3}.${4}"
      state: "${5}"

  - match: 'servers\.([^_]*)_([^_]*)_([^_]*)_([^_]*)\.([^.]*)\.([^.]*)$'
    match_type: regex
    name: freenas_graphite_${5}
    labels:
      job: freenas-graphite-raw
      instance: "${1}.${2}.${3}.${4}"
      item: "${6}"

  - match: 'servers\.([^_]*)_([^_]*)_([^_]*)_([^_]*)\.(.*)'
    match_type: regex
    name: freenas_graphite_raw
    labels:
      job: freenas-graphite-raw
      instance: "${1}.${2}.${3}.${4}"
      graphite_metric: "${5}"

  - match: 'sensor.*.*'
    name: sensor_${5}
    labels:
      job: esp32-sensors
      instance: ${1}.${2}.${3}.${4}
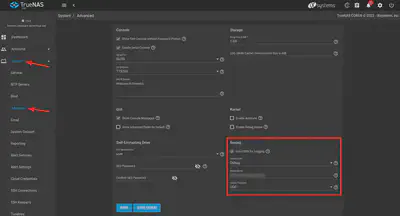
Configure the Graphite target on TrueNAS
Under System > Reporting, set the Graphite server’s IP address. I also like to have CPU usage reported as percent instead of units of kernel time (a.k.a. jiffies).
See the reference documentation here:
https://www.truenas.com/docs/scale/scaletutorials/reporting/configreportsscale/
graphite_exporter to listen on the default Graphite UDP port 2003.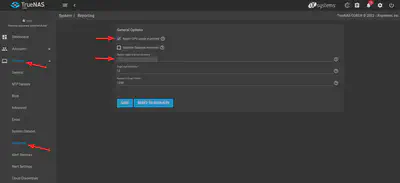
Scrape Graphite Exporter metrics in Prometheus
This is my scrape config in Prometheus.
scrape_configs:
  - job_name: graphite
    static_configs:
      - targets:
          - <url of my graphite_exporter>:9108
    honor_labels: true
I set honor_labels to true so that Prometheus doesn’t overwrite the job and instance labels
that I defined in the graphite_exporter metrics mapping config.
See the scrape_config configuration reference for details:
https://prometheus.io/docs/prometheus/latest/configuration/configuration/#scrape_config
Example Prometheus queries
Here are a few examples of PromQL expressions I use in Grafana dashboards based on the metrics mapping configuration above.
In these examples, $instance is a Grafana dashboard variable
and $__interval is a global variable.
They are not part of PromQL syntax and will be substituted by Grafana when executing the queries.
CPU usage:
avg without (cpu) (
    sum without (mode) (
        max_over_time(freenas_cpu_percent{instance=~"$instance",mode!="idle"}[$__interval])
    )
)
Load average:
freenas_load_1
freenas_load_5
freenas_load_15
Filesystems usage:
sum by (instance) (freenas_df_used{instance=~"$instance"})
Top 10 filesystems:
topk(10,freenas_df_used{instance=~"$instance"})
Conclusion
Graphite was revolutionary in 2010 and still has great support in Grafana, but Prometheus is much more efficient, modern, scalable, and easy to use.
Some legacy systems, network and storage appliances in particular, aren’t equipped to work natively with modern monitoring and logging systems.
TrueNAS is not instrumented with Prometheus metrics, and there is currently no exporter which could read metrics from the API and expose them in Prometheus format. However, TrueNAS does generate Graphite metrics, and there is a Graphite Exporter which can translate Graphite metrics for Prometheus.
For other similar use-cases, here are a few methods to get metrics from legacy systems into Prometheus:
- Using an exporter if one exists.
- Writing an exporter.
- Using SNMP Exporter.
- Using the InfluxDB Exporter.
- Using the statsd exporter.
- Using the Prometheus output data format in Telegraf if it’s easier to use Telegraf (this is how I do it for my pfSense router).
Alexandre de Verteuil
Senior Solutions Architect
I teach people how to see the matrix metrics.
Monkeys and sunsets make me happy.