Using Rsyslog and Promtail to relay syslog messages to Loki
Technical howto article

Summary
I use Promtail to collect logs from my VMs and send them to Loki.
I also want to collect logs from appliances where it’s more difficult to deploy Promtail. For example, my TrueNAS storage server, and my pfSense router/firewall. My HAProxy reverse proxy requires a syslog server for activity logs. For those cases, I use Rsyslog and Promtail’s syslog receiver to relay logs to Loki.
From the Promtail documentation
for the syslog receiver configuration:
The
syslogblock configures a syslog listener allowing users to push logs to Promtail with the syslog protocol. Currently supported is IETF Syslog (RFC5424) with and without octet counting.The recommended deployment is to have a dedicated syslog forwarder like syslog-ng or rsyslog in front of Promtail. The forwarder can take care of the various specifications and transports that exist (UDP, BSD syslog, …).
The Promtail documentation provides
example syslog scrape configs with rsyslog and syslog-ng configuration stanzas,
but to keep the documentation general and portable
it is not a complete or directly usable example.
Here, I provide a specific example built for an Ubuntu server, with configuration and deployment details.
Table of Contents
Architecture diagram

Reference documentation
- https://grafana.com/docs/loki/latest/clients/promtail/scraping/#syslog-receiver
- https://www.rsyslog.com/doc/v8-stable/concepts/multi_ruleset.html#split-local-and-remote-logging
Configuration files
Rsyslog “remote” ruleset
On Ubuntu, Rsyslog is installed by default.
Any .conf file added in /etc/rsyslog.d
will be read and included in the configuration.
The config file below creates a “remote” ruleset which does not interfere with the default local logging. It relays whatever comes in via TCP and UDP on port 514 to Promtail listening on TCP port 1514.
/etc/rsyslog.d/00-promtail-relay.conf
# https://www.rsyslog.com/doc/v8-stable/concepts/multi_ruleset.html#split-local-and-remote-logging
ruleset(name="remote"){
  # https://www.rsyslog.com/doc/v8-stable/configuration/modules/omfwd.html
  # https://grafana.com/docs/loki/latest/clients/promtail/scraping/#rsyslog-output-configuration
  action(type="omfwd" Target="localhost" Port="1514" Protocol="tcp" Template="RSYSLOG_SyslogProtocol23Format" TCP_Framing="octet-counted")
}


# https://www.rsyslog.com/doc/v8-stable/configuration/modules/imudp.html
module(load="imudp")
input(type="imudp" port="514" ruleset="remote")

# https://www.rsyslog.com/doc/v8-stable/configuration/modules/imtcp.html
module(load="imtcp")
input(type="imtcp" port="514" ruleset="remote")
Promtail configuration
I have a Promtail process running on all of my VMs to collect journal logs for Loki. In order to not interfere with the “journal” Promtail, I deploy a separate “syslog” Promtail on my Watchtower VM.
Here’s my promtail-syslog.yml configuration, including the scrape_configs
to save basic message metadata as labels.
See the available labels in the
syslog config reference.
/etc/promtail-syslog.yml
server:
  http_listen_port: 9081
  grpc_listen_port: 0

positions:
  filename: /var/tmp/promtail-syslog-positions.yml

clients:
  - url: http://loki.alexware.deverteuil.net:3100/loki/api/v1/push

scrape_configs:
  - job_name: syslog
    syslog:
      listen_address: 0.0.0.0:1514
      labels:
        job: syslog
    relabel_configs:
      - source_labels: [__syslog_message_hostname]
        target_label: host
      - source_labels: [__syslog_message_hostname]
        target_label: hostname
      - source_labels: [__syslog_message_severity]
        target_label: level
      - source_labels: [__syslog_message_app_name]
        target_label: application
      - source_labels: [__syslog_message_facility]
        target_label: facility
      - source_labels: [__syslog_connection_hostname]
        target_label: connection_hostname
Promtail systemd service
This is how I run Promtail as a service.
As I described above, I already run a promtail.service
on every VM to collect logs from the local journal.
On my Watchtower VM, I run the syslog receiver as a separate Promtail process.
/etc/systemd/system/promtail-syslog.yml
[Unit]
Description=Promtail syslog relay

[Service]
User=root
ExecStart=/usr/local/bin/promtail-linux-amd64 --config.file=/etc/promtail-syslog.yml

[Install]
WantedBy=multi-user.target
pfSense remote logging configuration
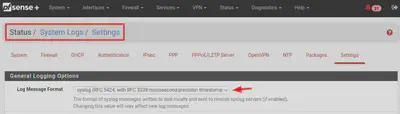
Under Status > System Logs > Settings, You can toggle between log message formats.
- BSD (RFC 3164, default)
- syslog (RFC 5424, with RFC 3339 microsecond-precision timestamps)
Even with the RFC 5424 format selected, logs are sent over UDP, so an Rsyslog relay is still required.
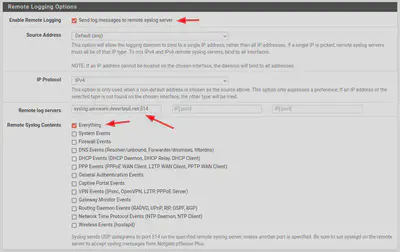
Below on the same page, in the Remote Logging section, you can specify a remote syslog server.
TrueNAS remote logging configuration
Under System / Advanced, you can configure a remote syslog server.
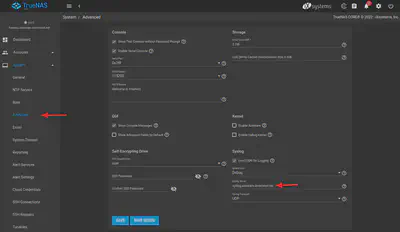
See also Monitoring TrueNAS with Prometheus and Loki.
HAProxy remote logging configuration
HAProxy provides very structured and detailed logs, but requires a syslog server.
This configuration in my haproxy.cfg sets the syslog server for all proxies configured with log global.
global
	log    syslog.alexware.deverteuil.net:514  local0  info
- HAProxy logs description:
http://docs.haproxy.org/2.0/configuration.html#8 - The
logconfiguration parameter in theglobalconfig section:
http://docs.haproxy.org/2.0/configuration.html#log
Alexandre de Verteuil
Senior Solutions Architect
I teach people how to see the matrix metrics.
Monkeys and sunsets make me happy.