Troubleshooting pfSense reboots with Grafana
An observability story with cool dashboarding techniques
Let me tell you the story of how I used Grafana while troubleshooting random reboots of my pfSense router.
In this post, I will demonstrate:
- How I collect logs from pfSense into Loki.
- How I used Loki and Grafana to visualize randomly reoccurring spontaneous reboots of my pfSense router.
- How I created an “issue monitoring dashboard” with a semi-relative time range.
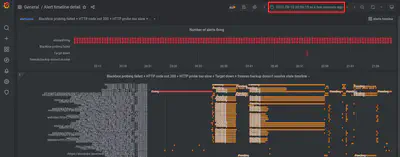
- How I use the new State timeline panel in Grafana 8 to monitor Prometheus alert states.
- The process of replacing the pfSense router and the effect on monitoring alerts and dashboards.
The observability journey
I’m in the middle of an observability journey for gathering metrics and logs from my pfSense and TrueNAS boxes.
I notice that every observability journey is a bit different. As the various software and process building blocks of observability are assembled, sometimes metrics are available before logs. Other times it’s the reverse, logs are available before metrics. It depends what telemetry data is available out of the boxes, and what observability software I have available.
I found out it’s easier to collect logs from network appliances using the syslog and SNMP legacy protocols. Here is the sequence of observability milestones in which my troubleshooting story happens:
Milestone 1: Local monitoring
This is where I was before I started building a watchtower server with Grafana, Prometheus and Loki.
- Using the web UI and the command line, top, route table, admin dashboards.
- No history data for logs and metrics.
Milestone 2: Logs
I am here!
- No metrics yet.
- I have Loki, I can use LogQL, I generate metrics from logs.
Milestone 3: Add Prometheus metrics
Work in progress!
- There’s no stable and maintained pfsense_exporter or truenas_exporter out in the open source community.
- For pfSense and TrueNAS, I think the easiest way to get metrics in Prometheus is to use snmp_exporter.
Collecting pfSense logs in Loki
Here is the high-level log data path in my architecture:
pfSense → rsyslog → Promtail → Loki
To configure remote logging in pfSense:
- Login to pfSense.
- Go to the Status > System Logs > Settings page.
- Scroll to the Remote Logging Options section.
- Type the address and port of the
rsyslogserver.
This rsyslog server forwards logs to the syslog receiver in Promtail, wich forwards them to Grafana Loki.
See Using rsyslog and Promtail to relay syslog messages to loki for more details about this setup.
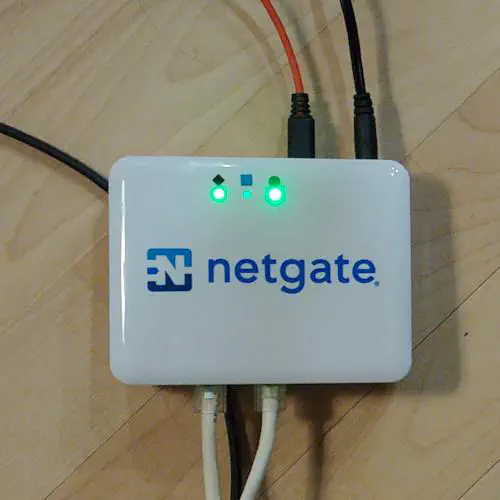
2021-08-05 Support request to Netgate
My Netgate SG-1000 router started rebooting spontaneously about once per week. Every time this happened, my ADSL modem cut off the internet connection, and the connection remained down until I restarted the modem. Every time this happened, my router wouldn’t obtained a DHCP address from the ISP, and the internet connectivity remained down until I rebooted my modem.
I found an issue on the Netgate forum that describes my problem:
https://forum.netgate.com/topic/144636/sg-1100-intermittent-reboots
On August 5, I opened a support request with Netgate. Netgate Support helped me download and install the latest firmware, but the problem persisted, the reboots continued. My router was no longer under warranty so I bought a new one, which arrived on August 13.
Issue dashboard
During this investigation, I created very specialized dashboards based on a very slim use-case. It is so specialized and single purpose that it will need to have an archival or deletion plan. In my home server, I put such dashboards in a folder called ‘Alexandre R&D’. I also make sure not to tag those dashboards until they are ready to be “discoverable”.
Grafana Explore might be a better place to run quick queries while responding to an alert. But the difference in this use-case is that the issue spanned several weeks, and the same queries and visualizations will be used many times over this period of time.

I wonder if some teams out there have a standard operating procedure for creating issue dashboards. Dashboards can be cross-linked with an issue in an issue tracker. The title could be dated and have an issue number.
An issue dashboard is super-relevant around a specific date and time, and become less relevant as we move away from that moment in time. They can almost be managed the same way as project documentation.
Relative time ranges
A cool feature of the time range selector in Grafana is the fact that you can do semi-relative time range. This means the start time is an absolute time stamp, and the end time is the relative time to ’now’. This allows you to ‘fix’ the start of the time range, and watch what happens since that time and now, in real time. As this happens, the plot will automatically and progressively zoom out to show more history and fewer details. As this happens, the relevance for details also decreases, while the relevance for history trend increases.
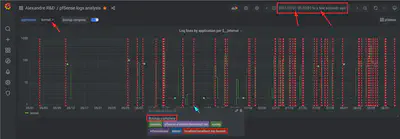
kernel syslog application. The annotation marks every appearance of the sting “Bootup complete” in the logs. I use this dashboard to quantify and visualize the random reboots pattern.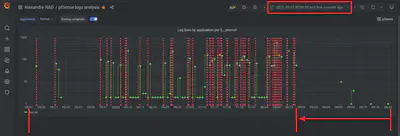
It shows the increase in frequency of the unplanned reboots from May to August. We can clearly see that after replacing the hardware on August 15, the problem stopped.
Notice how the start of the graph remains fixed, so that we can see the entire history of the problem at all times, and we can easily tell that the problem is resolve. As time advances, the graph compresses to the left.
Annotation query:
{host="pfsense.[…]",application="kernel"} |= "Bootup complete"
Graph query:
sum by (application) (count_over_time({host="pfsense.[…]",application=~"$application"}[$__interval]))
The graph query has a ‘Max data points’ query option value of ‘120’.
Properties of “project” dashboards
- They are dashboards created just for monitoring one issue happening in a limited time scope.
- They may have a semi-relative time range for ongoing monitoring during and after the project time scope.
- Start: an absolute timestamp like
2021-05-01. - End: a relative timestamp like
now.
- Start: an absolute timestamp like
- They go against the practice of avoiding dashboard sprawl, but such dashboards could be created in an ‘Issues’ folder, or a folder named after a team or a person.
- As with project documentation, a
yyyy-mm-dddate in the dashboard or folder name can make it easier for future users to understand it in temporal context.
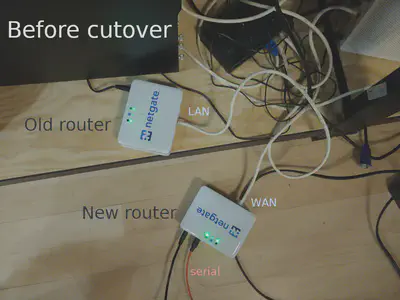
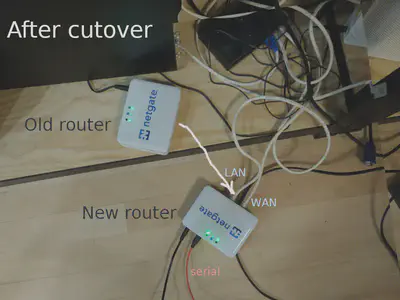
2021-08-15 Replacing the router
Maintenance steps:
- Login to the admin panel on the old router.
- Download a backup of the configuration.
- Connect to the new router’s serial port.
→ Netgate 1100: Connecting to the Console Port - Power on the new router.
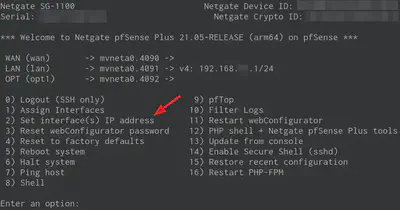
- Configure the LAN interface IP address via the serial console.
- Connect to the HTTPS admin interface. The default username and password is admin:admin.
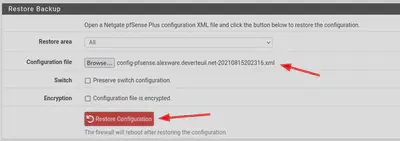
- Restore the configuration from backup.
- Restart the router.
- Check services and infrastructure monitoring alert states.
 of 5 minutes, which gives enough time for most systems administration maintenance tasks.](/post/troubleshooting-pfsense-reboots-with-grafana/alert-timeline-detail-target-down_huc26d5129f93056ea0007db0b66861cbd_102442_09e076bdc5a483f0f7b83a283bdbd010.webp)
Alexandre de Verteuil
Senior Solutions Architect
I teach people how to see the matrix metrics.
Monkeys and sunsets make me happy.