Visualize Matomo metrics in Grafana
Technical howto article
Matomo is a free and open-source alternative to Google Analytics. It collects events and reports statistics on page views and other actions by website visitors. It’s written in PHP, uses a MySQL database as a storage backend, and is easy to self-host. I use it on my website for collecting visitors and page views statistics.
I use Grafana (obviously) to monitor all of my virtual machines and services. I’ve been looking for ways to visualize Matomo metrics in Grafana as well, but there is no native plugin for Grafana. Here is what I was able to do using a generic JSON API data source plugin:
Documentation
Here are some reference documentation pages that are useful for this project.
- Matomo Reporting API Reference
- In Matomo, there is a useful interactive API reference under Platform > API. I used the API and Action modules.
- JSON API data source plugin in Grafana’s plugins repository.
- JSON API data source documentation
- JSONPath reference
Attempt 1: Connect directly to the MySQL database
I created a
MySQL data source
in Grafana and connected it to my matomo database using a read-only user.
Then I tested the SQL example queries from this
Matomo how to article,
but most of them didn’t work out right away.
There were probably some changes to the database schema since the article was written.
Studying the database schema is a bit too involved for a casual weekend project, and there is no guarantee that the schema won’t change in the future.
Attempt 2: Using the CSV API
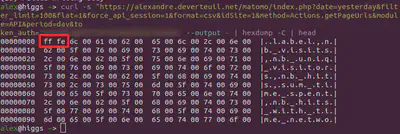
I tried using Marcus Olsson’s Grafana CSV data source. I’m sure the data source works well, but I ran into an issue where the CSV document returned by the Matomo API has some Unicode byte order marks that the CSV data source plugin doesn’t remove.
Plus after inspecting the CSV data returned by Matomo, I noticed null bytes between each character. This made me lose trust in the CSV output and I continued to the next step.
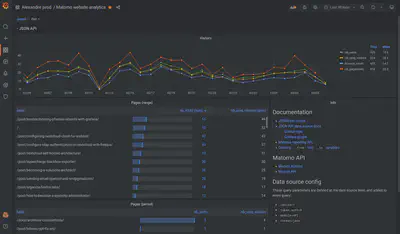
Attempt 3: Using the JSON API
The JSON output format from Matomo is much cleaner and easier to work with, so I installed Marcus Olsson’s JSON API data source for Grafana.
Setting up the JSON API data source
To create an auth token in Matomo, go to Settings > Personal > Security. Then scroll down to the Auth tokens section at the bottom.
In the Grafana data source config, I defined the URL path and a few query parameters that must be present in every query.
- Data source name:
Matomo JSON API - URL:
https://<your_domain>/matomo/index.php - Query string:
idSite=1&token_auth=<your_matomo_token>&module=API&format=json.
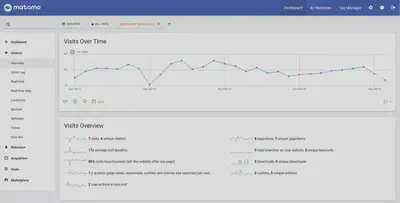
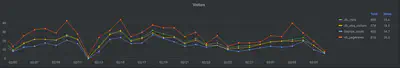
Building a panel for visitors over time
I’ll show you how to build a panel that shows Visitors as a time series using Matomo’s reporting API.
- Create a dashboard variable.
Name: period
Type: custom
Values:day,week,month,year,range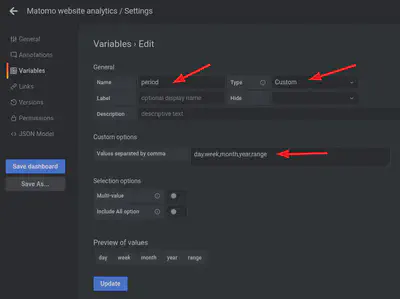
- Create a new panel.
- Select your Matomo JSON API data source.
- In the query editor, go to the Params tab.
- Enter the following parameters:
- method:
API.get - date:
${__from:\date:YYYY-MM-DD},${__to:\date:YYYY-MM-DD}- Don’t include the
\beforedate, it’s to prevent my blog from displaying the 📅 (date) emoji. - see also Global variables $__from and $__to for reference
- Don’t include the
- period:
$period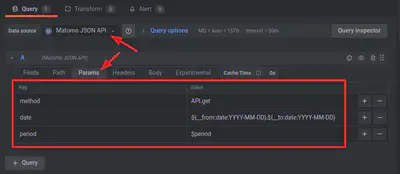
- method:
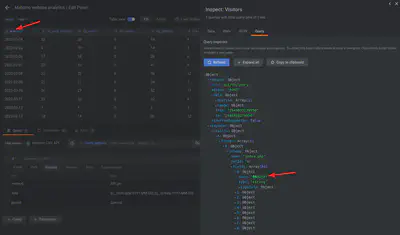
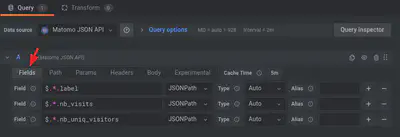
- Open the Fields tab and enter JSONPath expressions to extract the data.
See the Metrics Definitions in the Matomo API Reference.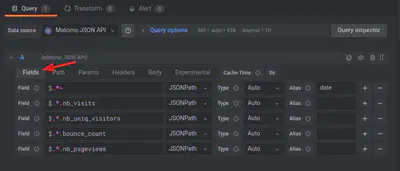
- Customize some visualisation options on your time series panel.
- Done.
Building a panel for URL actions
Now let’s build a table panel listing page hits for the selected time range. There are two ways to query the Reporting API: with a single date, and with a date range.
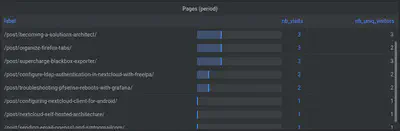
Single period
This is a table similar to what you would see in Matomo under Behaviour > Pages.
It will show the actions for the $period (day, week, month, year)
ending at the dashboard’s $__to date (the end of the selected time range).
For example, if the time range is from now-30d to now,
and the $period is day,
then the table will display the page views for the current day so far.
- Follow the steps 1 to 4 as above to create a panel and select the Matomo JSON API data source.
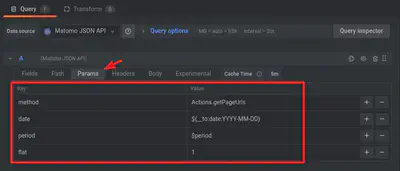
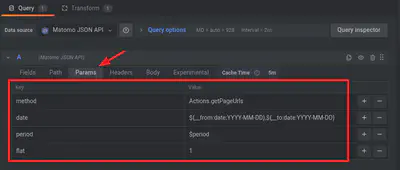
- In the Params tab, enter the following:
- method: Actions.getPageUrls
- date:
${__to:\date:YYYY-MM-DD}- Don’t include the
\beforedate, it’s to prevent my blog from displaying the 📅 (date) emoji.
- Don’t include the
- period:
$period - flat: 1
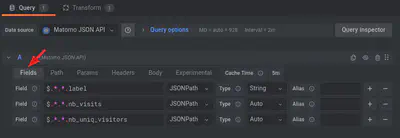
- Select some fields.
- Customize some visualisation options on your table panel.
- Done.
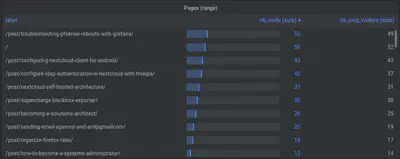
Range query
The API allows the date parameter to be a date.
This changes the format of the returned JSON data a little bit.
The same fields will be present, but under a dictionary key for each date in the selected range.
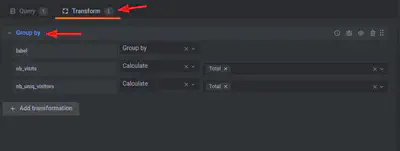
I will use the
Group By Transformation
to sum the page views by URL and remove duplicates.
- Follow the steps 1 to 4 as in the section Building a panel for visitors over time.
- In the Params tab, enter the following:
- method: Actions.getPageUrls
- date:
${__from:\date:YYYY-MM-DD},${__to:\date:YYYY-MM-DD}- Don’t include the
\beforedate, it’s to prevent my blog from displaying the 📅 (date) emoji.
- Don’t include the
- period:
$period - flat: 1
- Select some fields.
Notice the additional level of drilldown in the JSONPath compared to the single period query.
- Add a Group By transform.
- Customize some visualisation options on your table panel.
- Done.
Things to try next
If there’s something I can’t do in Grafana using the JSON API data source,
Matomo widgets can be embedded in an iframe.
https://matomo.org/docs/embed-matomo-reports/
Alexandre de Verteuil
Senior Solutions Architect
I teach people how to see the matrix metrics.
Monkeys and sunsets make me happy.